When the design of a new product becomes more detailed the tools that predict the behaviour should contain more detailed information as well. In this stage the "System integration" and the "Component evaluation" should be done.
Component evaluation
A good example of the component evaluation is the study of the actuator flexibility. In the actuator the driving force is generated in the coil. The displacement is measured at the lens. The design of the actuator body connecting the coil and the lens should be sufficiently stiff. In this case a finite element model of the actuator was made to determine the transfer curve from force to displacement. At present such analysis are being made in the "ANSYS" finite element program. In such analysis it will be of importance to obtain results that may be directly compared with results that are obtained from measurements. Only in this case the results will be used in discussions with mechanical designers and servo system engineers. An example of the "mesh" description and the resulting transfer curve obtained is given in figure 5.4.
SYSTAN
The other field of detailed modelling will cover the behaviour of the total CD-module. In this case relatively rough models of all the components are combined in one system model. This system model is also based on the finite element principle. For this purpose the "SYSTAN" package is used. In this package it is also possible to use results from the component evaluation. In that case a reduced description from the ANSYS analysis is transported to the SYSTAN environment. Similarly results from experimental analysis of components can be combined in SYSTAN. The analysis in SYSTAN should produce results that are similar to those obtained from actual testing of a prototype. An example of such a result is shown in figure 5.5. This transfer curve was obtained during a trial analysis performed to test the "SYSTAN" program on a CD-module (ref.3).
Philpac
Three different tools for theoretical analysis have been mentioned. From these three "Philpac" is considered as a general purpose tool. Time and frequency domain analysis of linear and non-linear systems may be performed. In Philpac results from analysis in the modelling tools Ansys and Systan may be used for further analysis. The Systan package is an intermediate tool. It can use Ansys results together with simple models and results from experiments to create complete models of a CD-module. The Ansys tool is best suited to create detailed models of structural elements such as an actuator body or a frame.
Modal Analysis
During the past 15 to 20 years the experimental technique of "Modal Analysis" has been used to analyse vibration problems in different fields. Examples are found in aeronautics, automobile industry, noise analysis, civil structure analysis, etc. Basically the theory uses the fact that lightly damped structures have distinct resonance frequencies. At those frequencies the deformations may become relatively large. The relative movements of parts of the structure are either in-phase or exactly out of phase. In this case the total dynamic behaviour, both in time domain and in frequency domain, may be determined using the information about the frequencies and deformation shapes in the frequency range of interest.
On this basis a relatively simple, so called "modal", model of a complex structure may be obtained. To gather the information a series of measurements is done. The structure is excited at one point. The accelerations at different points are measured. From the transfer curves the resonance frequency is determined. Using the relative amplitudes at resonance and the phase information at the different points in the structure the associated shape of deformation is estimated.
This technique has been used to identify problem sources in prototypes of CD-modules. An interesting example is the radial arm for CDM-3. In the first prototype a resonance at about 3600 Hz was noticed. A grid of measuring points on the arm is defined and measurements at all points in the radial direction were performed. In figure 5.6 the original and the deformed grid pattern are shown. Once the shape of deformation was identified the source of unexpected flexibility was found. The corrections in the design increased the resonance frequency to about 6800 Hz. which is far above the intended bandwidth of CDM-3 radial servo system.
This technique and its applications is still under development. Apart from the visual inspection of the "mode-shape" the numerical information from the experiments can be used in computer analysis, for instance in SYSTAN and in PHILPAC. Due to this integration of experimental and theoretical tools the quality of predictions can be increased and the total set of tools will become more powerful for the mechanical designer and for the servo system engineer.
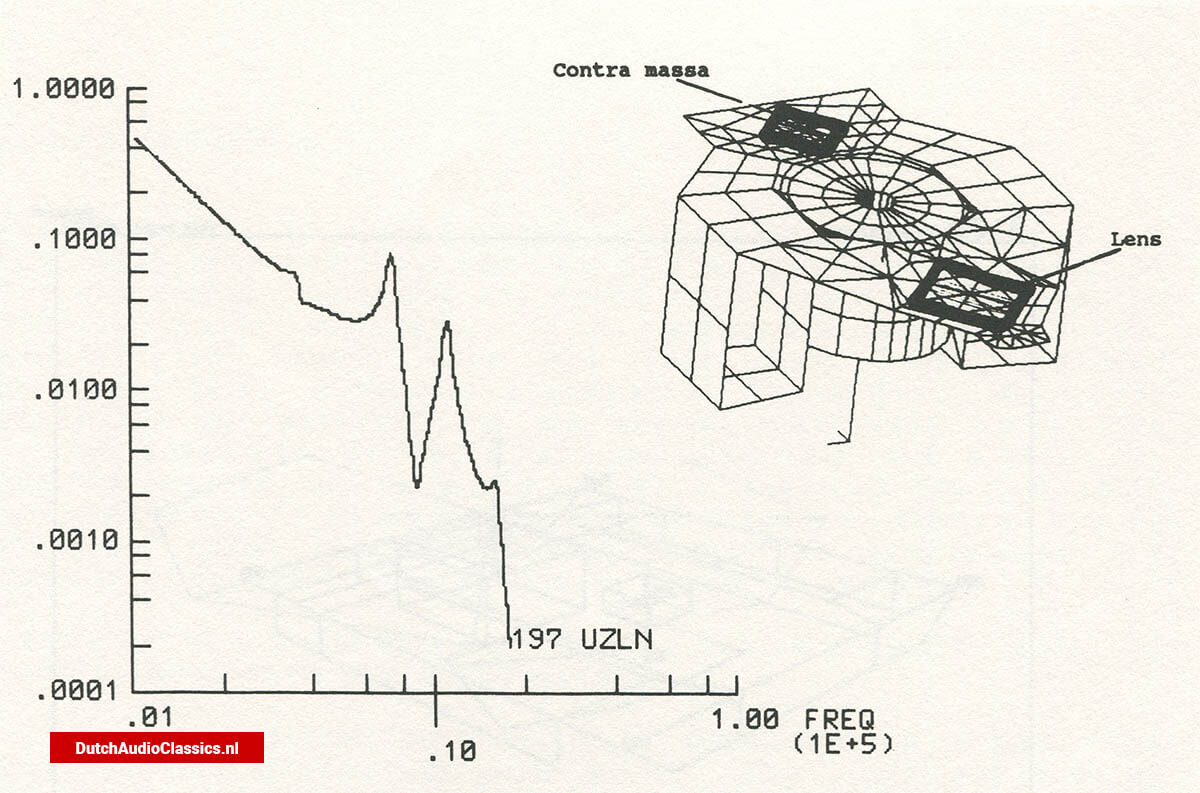 Figure 5.4. An example of the Finite Element model for a focus actuator and the resulting transfer curve, from driving force to lens displacement, that was determined (ref.2)
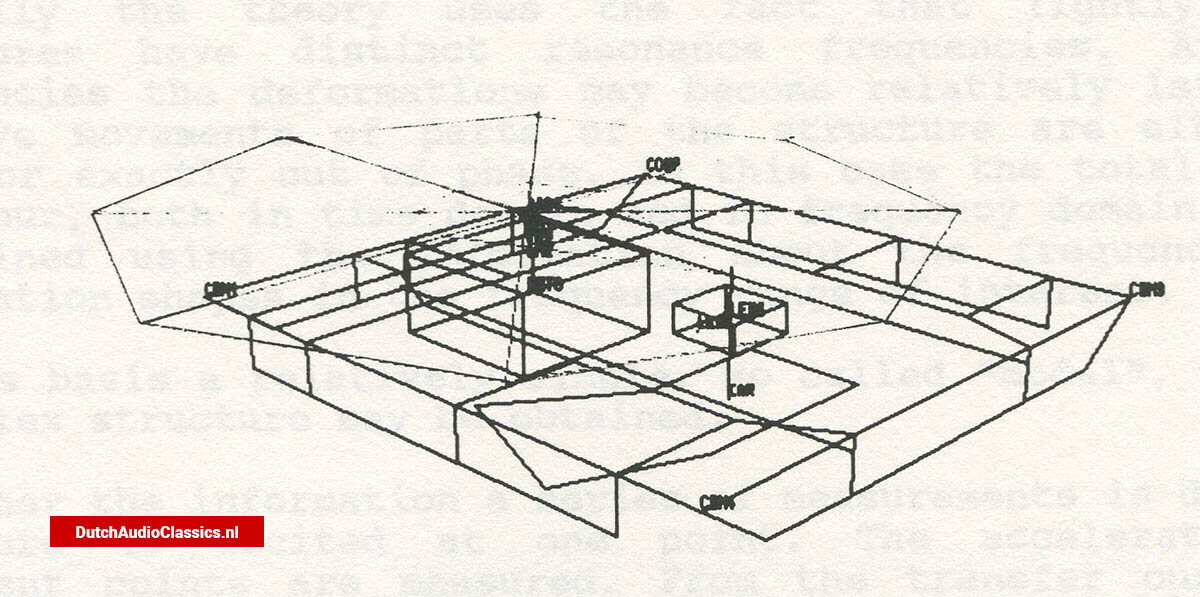
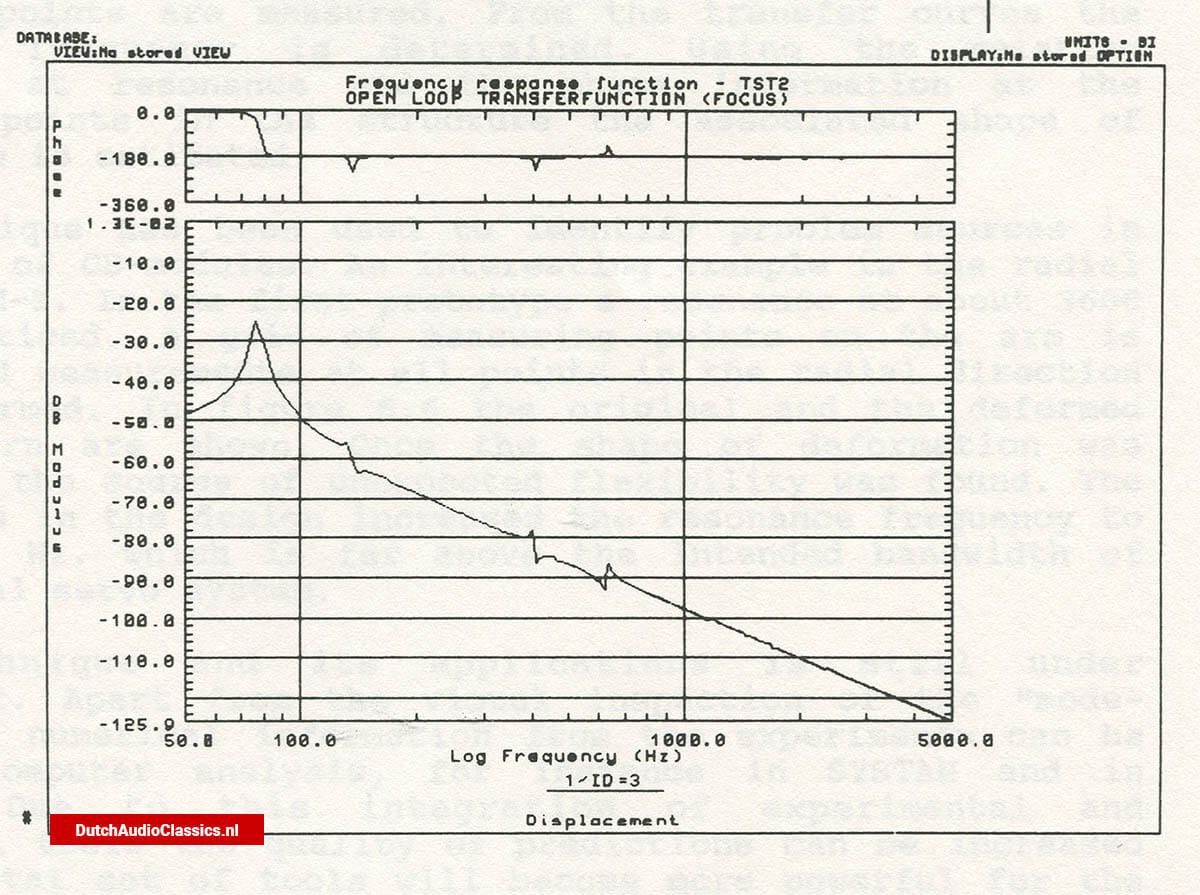 Figure 5.5. An example of the Element model generated with the SYSTAN modelling tool for a complete CD-module and the calculated transfer curve for the radial servo system.
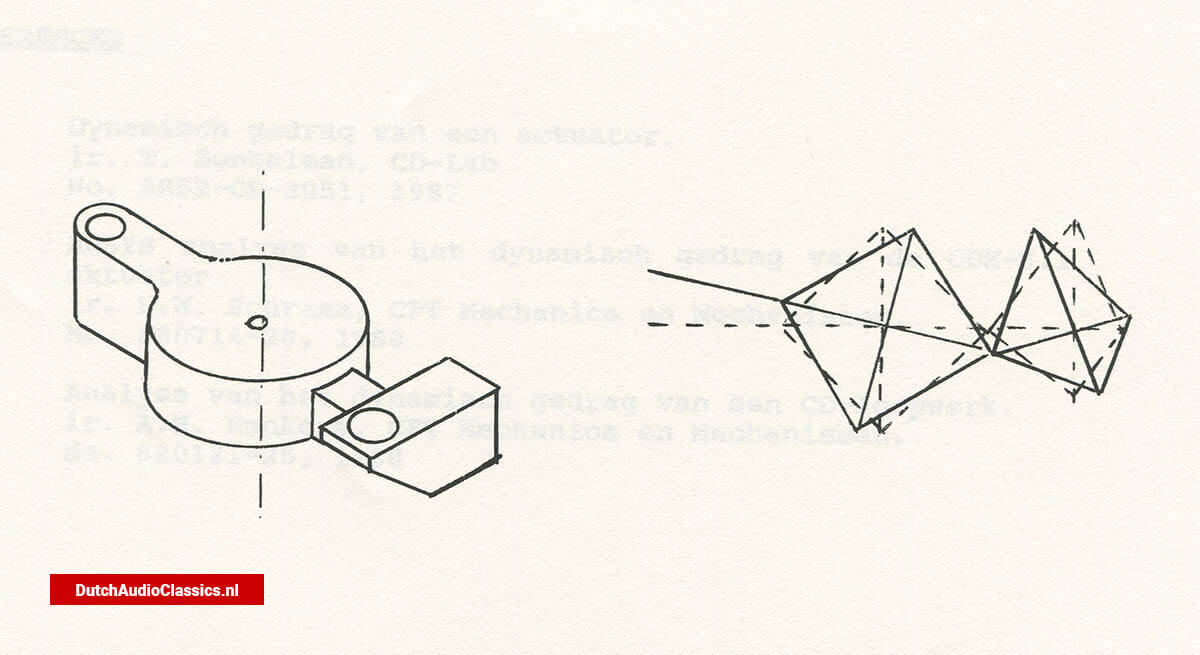 Figure 5.6. Schematic representation of the "arm" for CDM-3 and the deformation shape measured with the "Modal Analyzer" at a frequency of about 3600 Hz.